| Trend Analysis - Analyzing aggregate response data over time |
|
By: Vivek Bhaskaran
CEO, QuestionPro |
|
"With the past, we can see trajectories into the future - both catastrophic and creative projections."
The following data points can be measured (Y-Axis)
The "Time Factor" (X-Axis) can have the following granularity
Trend Analysis can be extremely valuable as an early warning indicator of potential problems and issues with product line and service level changes that impact customers. If you see a dip in the "mean" for a Continuous Variable satisfaction question after a particular "marketing event" you can immediately start investigating the dip and explore causes of the decrease in satisfaction levels. It can also be used to gauge response rates over time. Marketing events can be anything from product or service enhancements and upgrades to general communications to your customers. A good example is a "website usability upgrade" - many organizations go to great lengths to make their website more usable, but fail to asses impacts before and after the upgrades. A "Customer Pulse" survey that asks visitors to rate the website on a 7pt scale should have a mean that is flat before the upgrade. After the upgrade, Trend Analysis can reveal the "jump" or "decline" in satisfaction levels of your customers. This can also be used to simulate, by using focus groups or a representative sample, the potential increase or decrease in satisfaction levels. This data can be further used for various cost/benefit analyses. Trend Analysis can only be performed on "Quantitative" question types like Multiple Choice, Rank order and Constant Sum. Questions that have textual input (Qualitative) cannot be used for trend analysis. The Trend Analysis data can be accessed real time by going to the "Trend Analysis" section in the "View Results" tab. Load up the question you would like to perform the analysis on and choose the "Frequency" or the "Time Factor" you would like the analysis on. The output would be real-time graphs as well as the data set for the graphs in a CSV format for you to cut and paste into Excel.
Example Illustration: |

|
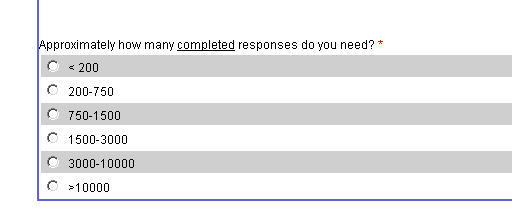
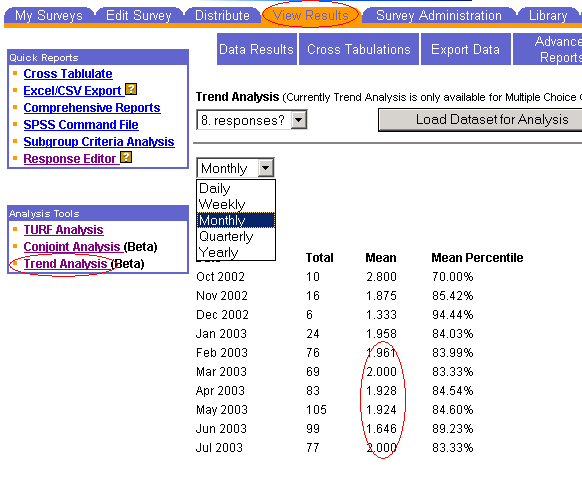
Now, basic frequency analysis gives us information about the "mean" responses that most of our users are looking for. But what we want is to analyze how that mean changes and varies over time. We use the Trend Analysis module for this. The following figure gives us information about how the mean varied over time.
|

|
From here we can find out that the mean remained consistent between January and June except for in June where it moved down to - (1.65) whereas otherwise it was between 1.9 and 2.0 for the other months. This merits some investigation into why the mean changed in June! We investigated this "dip" further and co-related it to a "Marketing Event" - Our advertisements, on Search Engine Sites like Google and Yahoo, were not running at their optimized settings in June! Pro-Active data analysis can help your organization be "in touch" with your customers and business partners. Trend Analysis provides you with an easy mechanism to monitor the aggregate response data filtering out the noise, for you to make informed decisions. |